In this post we are going to discuss how we are going to trade correlated pairs using the example of GBPJPY and GBPNZD. Just by looking at these 2 pairs you should get that idea that both these pairs are correlated due to GBP. The idea is to find an opportunity when the 2 pairs get out of sync with other other. This happens when the difference between the closing price of the 2 pairs becomes greater than 2 standard deviations from the mean of the differences. Did you take a look at our course Bayesian Statistics For Traders? Bayesian Statistics is a a powerful tool that lets you make an assumption then modify that assumption in light of new data. In this course I show in simple and step and step manner how you can use Bayesian Statistics to improve your trading. Bayesian statistics is a powerful tool that can be used to predict high and low as well as close after a certain period of time. Below is the python code of calculating the correlations between the 2 pairs. We have used a window of 500 observations in doing the calculations.
#import numpy module
import numpy as np
import matplotlib.pyplot as plt
#read the GBPJPY clsoing price from the csv files
c1=np.loadtxt("E:/MarketData/GBPJPY60.csv", delimiter=',', usecols=(5,), unpack=True)
c1.shape
#read the GBPNZD clsoing price from the csv files
c2=np.loadtxt("E:/MarketData/GBPNZD60.csv", delimiter=',', usecols=(5,), unpack=True)
c2.shape
#calculate the log returns of both pairs
returns1 = np.diff(np.log(c1))
returns2 = np.diff(np.log(c2))
#arrays are of different sizez we need to make them same size
returns1=returns1[(len(returns1)-500):len(returns1)]
returns2=returns2[(len(returns2)-500):len(returns2)]
returns1.shape
returns2.shape
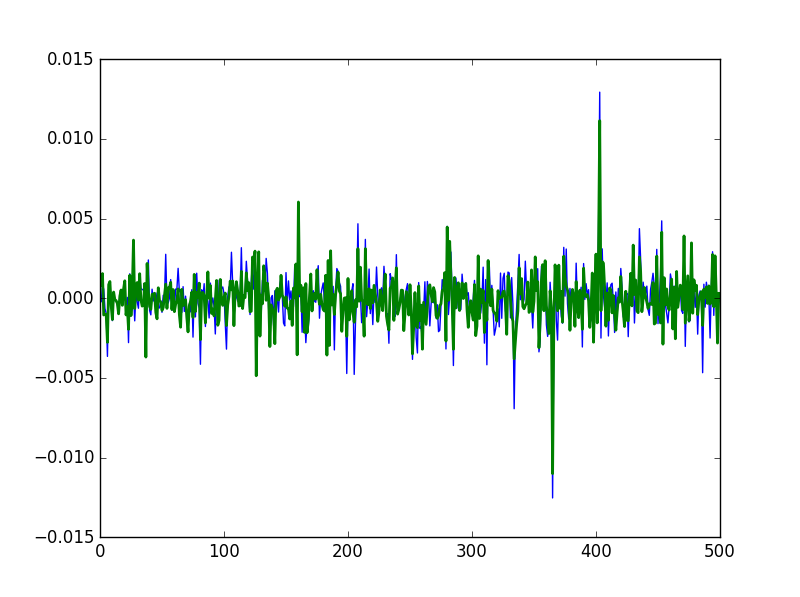
#plot the returns
t = np.arange(len(returns1))
plt.plot(t, returns1, lw=1)
plt.plot(t, returns2, lw=2)
plt.show()
#calculate the covariance matrix
covariance = np.cov(returns1, returns2)
print(covariance)
#claculate the correlation matrix
print(np.corrcoef(returns1, returns2))
When we run the code we get a correlation figure of 0.76 for GBPJPY and GBPNZD which is quite high. We have restricted the correlation data to 500 observations which is quite reasonable. Infact we should reduce this to around 200 observations. Between 200 and 500 observations is reasonable. Just keep this in mind this correlation is something that can change. So we have fixed the window to 500 observations in our code. You can change that. After 100 more observations you might get a different correlation figure.
However making this window wider than 500 observations will make the correlation figures skewed. Did you read the post on British Pound Flash Crash and Hunt Volatility Funnel? When you are trading GBP pairs, always keep an eye on the British economy and what the Bank of England is planning. As said above correlation can change from day to day. We are using 60 minute data. So there are 24 observations in day. So it can take a few days for correlation figure to change as we have fixed the window at 500 observations. If we narrow the window to 100 observation than the correlation figure can change rapidly. Below is the correlation calculated for GBPJPY and GBPNZD.
[[ 1. 0.76358135]
[ 0.76358135 1. ]]
Now 0.76 means GBPJPY and GBPNZD have good correlation with each other. What we need is to wait for an opportunity when the 2 pairs get out of sync with each other as stated in the first post. If the 2 pairs are correlated and they go out of sync we should expect prices to pullback to the established relationship. We are infact dealing with cointegrated time series. Cointegration works more in stock market than in currency market. Did you read the post on a recent EURUSD buy trade that made 150 pips with a small 15 pips?
#calculate the buy/sell signal
difference = c1-c2
avg = np.mean(difference)
dev = np.std(difference)

print(np.abs(difference[-1] - avg) > 2*dev)
So when the price difference between the 2 pairs becomes greater than 2 standard deviations of the mean of Now you can use other correlated pairs as well that can include EURUSD and GBPUSD 0r GBPUSD and GBPAUD and many more. I have used python code to do the calculations. You don’t need to worry if you don’t know python. You can do the calculations easily on Excel. As said above choosing between 200-500 observations is a good idea. You can do all the calculations on an Excel worksheet as well. It is upto you.