In this post we are going to give you the Fibonacci Pivot Point MT4 Indicator MQL4 code FREE. There are different formulas used to calculate the pivot points. The first is the standard formula. Then there is a formula that uses fibonacci retracement levels in calculating the different support and resistance levels. There is another formula that is called Caramilla Pivot Point formula. However all these formulas use the previous day’s high, low and close in making the calculations. So when we start trading today, we already have the previous day’s high, low and close which we can use to calculate the pivot point and the different support and resistance levels for today. Did you download latest FX Magazine issue FREE?
Fibonacci Pivot Points Formula
Below is an infographic that shows the formula that is used to calculate the 3 different support and resistance levels. Pivot point is calculated just like the standard formula by averaging the previous day’s high, low and close. The different support and resistance levels are however calculated using the fibonacci retracement levels.
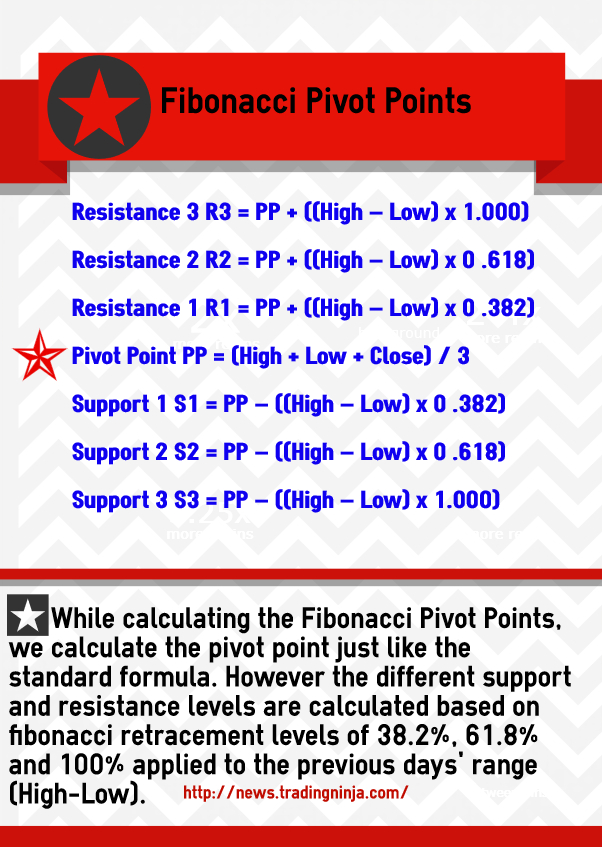
As you can see this is a leading indicator. When we start trading today, we have these support and resistance levels already calculated. So we know at what levels the market is going to react. Unlike fibonacci levels which are somewhat subjective meaning 2 traders will draw these levels differently. Fibonacci Pivot Points are calculated with a formula that is the same for each trader. So each trader has the same levels.
Download Fibonacci Pivot Point MT4 Indicator
You can download the Fibonacci Pivot Point MT4 indicator MQL4 code below. Just copy the MQL4 code below and paste it into a notepad file and save it as fibonaccipivot.mq4. Open MetaEditor in MT4 and open this file in the MetaEditor, compile it. This will generate the fibonaccipivot.exe file. Now click on File and then on Open Data Folder. This will open the Data Folder. Click on MQL4 folder and then drag these 2 files to the Indicators folder. You are now all set to use this indicator on your chart.
//+——————————————————————+
//| FibonacciPivot.mq4 |
//| Hassam |
//| http://tradingninja.com |
//+——————————————————————+
#property copyright “Hassam”
#property link “http://tradingninja.com”
#property version “1.00”
#property indicator_chart_window
#property indicator_buffers 7
#property indicator_color1 Orange
#property indicator_color2 DarkBlue
#property indicator_color3 DarkBlue
#property indicator_color4 Maroon
#property indicator_color5 Maroon
#property indicator_color6 Green
#property indicator_color7 Green
//—- input parameters
//—- buffers
double PBuffer[];
double S1Buffer[];
double R1Buffer[];
double S2Buffer[];
double R2Buffer[];
double S3Buffer[];
double R3Buffer[];
string Pivot=”Pivot Point”,Sup1=”S 1″, Res1=”R 1″;
string Sup2=”S 2″, Res2=”R 2″, Sup3=”S 3″, Res3=”R 3″;
int fontsize=10;
double P,S1,R1,S2,R2,S3,R3;
double LastHigh,LastLow,x;
//+——————————————————————+
//| Custor indicator deinitialization function |
//+——————————————————————+
int deinit()
{
//—- TODO: add your code here
ObjectDelete(“Pivot”);
ObjectDelete(“Sup1”);
ObjectDelete(“Res1”);
ObjectDelete(“Sup2”);
ObjectDelete(“Res2”);
ObjectDelete(“Sup3”);
ObjectDelete(“Res3″);
//—-
return(0);
}
//+——————————————————————+
//| Custom indicator initialization function |
//+——————————————————————+
int init()
{
string short_name;
//—- indicator line
SetIndexStyle(0,DRAW_LINE,0,2,Orange);
SetIndexStyle(1,DRAW_LINE,0,2,DarkBlue);
SetIndexStyle(2,DRAW_LINE,0,2,DarkBlue);
SetIndexStyle(3,DRAW_LINE,0,2,Maroon);
SetIndexStyle(4,DRAW_LINE,0,2,Maroon);
SetIndexStyle(5,DRAW_LINE,0,2,Green);
SetIndexStyle(6,DRAW_LINE,0,2,Green);
SetIndexBuffer(0,PBuffer);
SetIndexBuffer(1,S1Buffer);
SetIndexBuffer(2,R1Buffer);
SetIndexBuffer(3,S2Buffer);
SetIndexBuffer(4,R2Buffer);
SetIndexBuffer(5,S3Buffer);
SetIndexBuffer(6,R3Buffer);
//—- name for DataWindow and indicator subwindow label
short_name=”Pivot Point”;
IndicatorShortName(short_name);
SetIndexLabel(0,short_name);
//—-
SetIndexDrawBegin(0,1);
//—-
//—-
return(0);
}
//+——————————————————————+
//| Custom indicator iteration function |
//+——————————————————————+
int start()
{
int counted_bars=IndicatorCounted();
int limit, i;
//—- indicator calculation
if (counted_bars==0)
{
x=Period();
if (x>240) return(-1);
ObjectCreate(“Pivot”, OBJ_TEXT, 0, 0,0);
ObjectSetText(“Pivot”, ” Pivot Point”,fontsize,”Arial”,Red);
ObjectCreate(“Sup1”, OBJ_TEXT, 0, 0, 0);
ObjectSetText(“Sup1″, ” S 1″,fontsize,”Arial”,Red);
ObjectCreate(“Res1”, OBJ_TEXT, 0, 0, 0);
ObjectSetText(“Res1″, ” R 1″,fontsize,”Arial”,Red);
ObjectCreate(“Sup2”, OBJ_TEXT, 0, 0, 0);
ObjectSetText(“Sup2″, ” S 2″,fontsize,”Arial”,Red);
ObjectCreate(“Res2”, OBJ_TEXT, 0, 0, 0);
ObjectSetText(“Res2″, ” R 2″,fontsize,”Arial”,Red);
ObjectCreate(“Sup3”, OBJ_TEXT, 0, 0, 0);
ObjectSetText(“Sup3″, ” S 3″,fontsize,”Arial”,Red);
ObjectCreate(“Res3”, OBJ_TEXT, 0, 0, 0);
ObjectSetText(“Res3″, ” R 3″,fontsize,”Arial”,Red);
}
if(counted_bars<0) return(-1);
//—- last counted bar will be recounted
// if(counted_bars>0) counted_bars–;
limit=(Bars-counted_bars)-1;
for (i=limit; i>=0;i–)
{
if (High[i+1]>LastHigh) LastHigh=High[i+1];
if (Low[i+1]<LastLow) LastLow=Low[i+1];
if (TimeDay(Time[i])!=TimeDay(Time[i+1]))
{
P=(LastHigh+LastLow+Close[i+1])/3;
R1 = P + 0.382*(LastHigh-LastLow);
S1 = P – 0.382*(LastHigh-LastLow);
R2 = P + 0.618*(LastHigh-LastLow);
S2 = P – 0.618*(LastHigh-LastLow);
R3 = P + (LastHigh-LastLow);
S3 = P – (LastHigh-LastLow);
LastLow=Open[i]; LastHigh=Open[i];
ObjectMove(“Pivot”, 0, Time[i],P);
ObjectMove(“Sup1”, 0, Time[i],S1);
ObjectMove(“Res1”, 0, Time[i],R1);
ObjectMove(“Sup2”, 0, Time[i],S2);
ObjectMove(“Res2”, 0, Time[i],R2);
ObjectMove(“Sup3”, 0, Time[i],S3);
ObjectMove(“Res3”, 0, Time[i],R3);
}
PBuffer[i]=P;
S1Buffer[i]=S1;
R1Buffer[i]=R1;
S2Buffer[i]=S2;
R2Buffer[i]=R2;
S3Buffer[i]=S3;
R3Buffer[i]=R3;
}
//—-
return(0);
}
//+——————————————————————+
Fibonacci Pivot Point Trading Strategy
It is a good idea to combine these support and resistance levels with candlestick reversal patterns. If you find a strong candlestick reversal pattern forming on any one of these support and resistance level you can take it as a buy/sell signal. Take a look at the following screenshot.
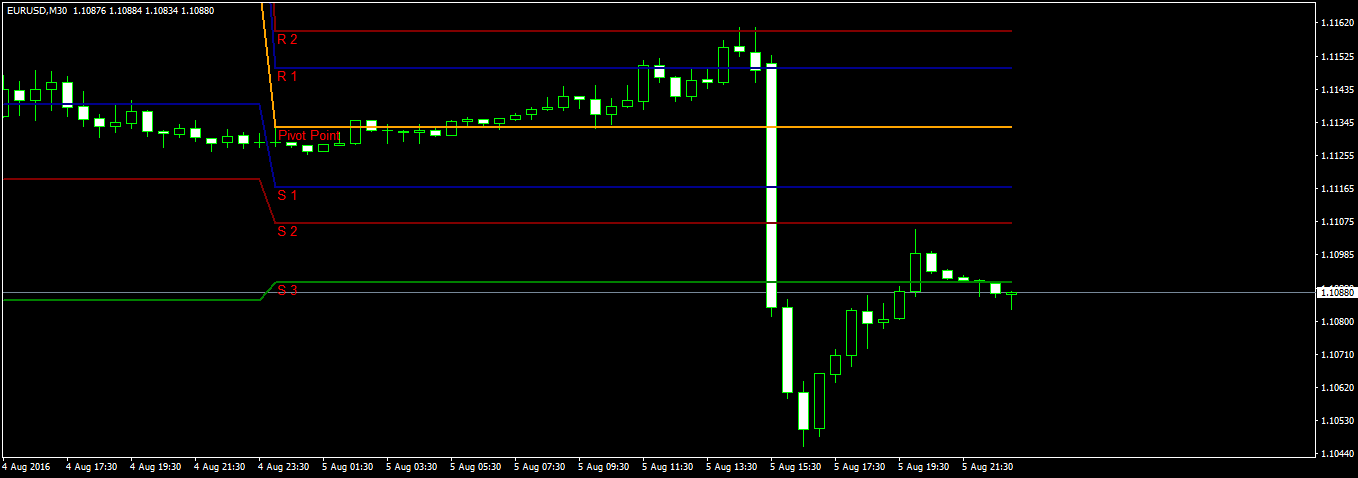
Above is a screenshot of EURUSD M30 just before this Friday NFP Report release. You can see in the above screenshot that just one hour before NFP Report release, price makes strong bearish patterns on R2 level which is a strong indication that price is going to breakout in the down direction. Our risk is only 10 pips. We place the stop loss above R2 level. Place take profit at S2 level which makes a profit of 150 pips in just 1 hour.
As said above it is always a good idea to combine candlestick reversal patterns with these levels. In the above screenshot you saw 2 strong bearish 30 minute bars forming just on R2 level. This is a signal that the NFP Report will be bearish for the market.