There are 5 different pivot point formulas that are used by traders in their daily trading. These are the standard formula, fibonacci pivot point formula, Caramilla pivot point formula, Woodie pivot point formula and De Mark’s pivot point formula. You can download Fibonacci Pivot Point MT4 Indicator FREE. This indicator draws the pivot point and the 3 different support and resistance levels on the chart. The following infographic explains the 5 different formulas that are used in calculating pivot points.
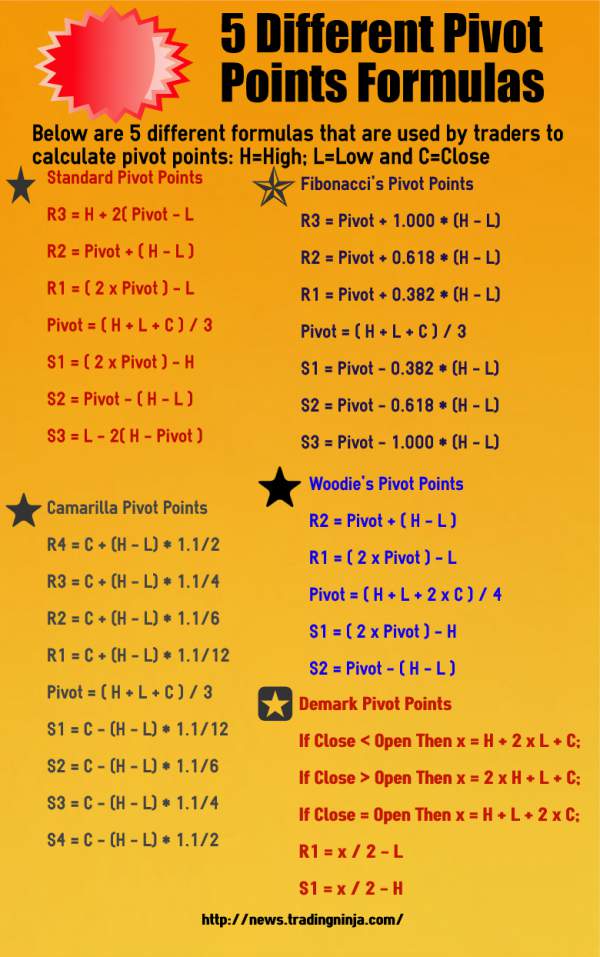
Now in the above infographic you can see there are 5 different formulas that traders use to calculate the pivot points and different support/resistance levels. Standard Pivot Point formula is based on adding High, Low and Close and dividing the sum by 3 which is same as averaging previous High, Low and Close. There are three support levels and 3 resistance levels used in the standard formula. Did you download your FX Trader Magazine latest copy FREE?
Fibonacci Pivot Point formula also calculates the pivot point by adding High, Low and Close and then dividing the sum with 3. But then it calculates the support/resistance levels using fibonacci ratios. Camarilla Pivot Point formula also calculates the pivot point by adding High, Low and Close of previous day and then dividing the sum with 3. However, it uses 4 support/resistance levels. There are some traders who love to trade with Camarilla Pivots. Woodie’s Pivot Point formula is totally different from standard formula and so is Demark Pivot Point formula. Did you download the Fibonacci Pivot Point Indicator? Just click on the link on the top of this post and you can download Fibonacci Pivot Point Indicator MQL4 code FREE.
How to Combine Candlestick Patterns With Pivot Point Levels?
There are a number of different pivot point trading strategies that have been developed. The simplest approach is when price is above daily pivot point, it means market is bullish and you will look for a long trade.. Look for a bullish candlestick pattern for entry. Your profit target should be either R1 or R2. In the same manner, when price is below the daily pivot level look for a short trade. Look for a bearish candlestick pattern for entry. Your profit target should be either S1 or S2. Combining pivot levels with candlestick patterns is a good strategy. Watch this webinar recording that shows how to use candlestick patterns in projecting profit targets. A good entry signal can be a doji. Look for a doji to form at any one of these S/R levels. Suppose price is hovering around S2 level. A doji gets formed close to the S2 level. This is a good buy signal. Now you should wait for a bullish candle to close above the doji close. This will be your entry. Also watch this video below that explains how to combine pivot points with candlestick patterns.
You must know this that Steve Nison is considered to be an expert when it comes to candlestick trading. He was the person who had introduced candlestick patterns to the western world. In the video below Steve Nison explains how to trade breakouts using pivot points and candlestick patterns.
https://www.youtube.com/watch?v=ukx1FgTM7TU
Now this is something very important for you to understand as explained in the above video. You should learn how to make money in the market despite being wrong half of the time. How do you do this when you are wrong half of the time? You do this by trying to catch the big moves in the market with small risk. Suppose you can catch a 100 pips move with a 20 pips stop loss. Suppose you lose 50% of the time. What this means is that in 10 trades, you have 5 losers and you lose 100 pips. But you are able to win 5 trades meaning you make 500 pips. Your net profit is 400 pips. This is how you make money. Combining candlestick patterns with pivot points is one of the methods to catch the big moves in the market.
Catching the big move means when your stop loss is 20 pips, your profit target should be at least 60 pips. You should also visit the last post on Fibonacci Pivot Points where you can download the Fibonacci Pivot Point Indicator MQL4 indicator and I also explain with screenshot how to trade with this indicator. Most of the time you will use the next S/R level as a profit target. Always make sure you only enter into a trade when the profit target is at least 3 times your stop loss. This gives you a Reward/Risk ratio of 3:1. So even with a winrate of 50%, you will make on average more than you lose and your account will keep on growing.